Google Analytics and Search Console can be an intimidating place for non-technical content creators.
I’ve found with tools like these, it’s not that people can’t use them, or learn how. But it’s having the confidence to remember which report to look at and what filters to apply.
Especially if content creation and analysis is only a small part of someone’s job.
So, I like to build simple interfaces in Google Data Studio. That way the marketing teams and creators know they’re looking at the correct report with simple options for filtering.
Bonus point! I’m really comfortable in both Analytics and Search Console, but even still I’ve found these data studio interfaces can speed up my own workflow. And in some cases they do things the native tool can’t or wont.
Here’s a collection of Google Data Studio interfaces I’ve created
- Search console query export
- Search console interface [ADVANCED]
- Website sponsor dashbaord
- SME website overview
- Organic traffic databoard
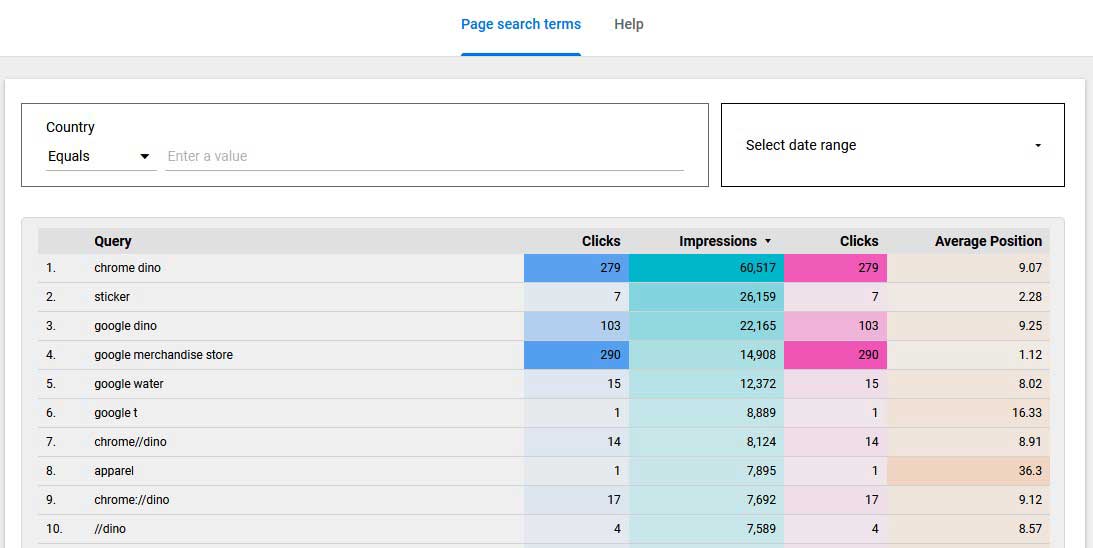
Search console query export
With this interface marketers and content creators can enter a URL and it will return all of the search queries that page ranks for. Including the number of clicks, impressions, click through rate and average position. And, you can view more than 1,000 rows – which is a limit in Search Console.
Brilliant if you quickly want to see how a page is performing in the search engines. Even better if you want to optimise the page around the search terms it’s ranking for.
What’s great is that the table can be exported to Excel or Google Sheets with a right click.

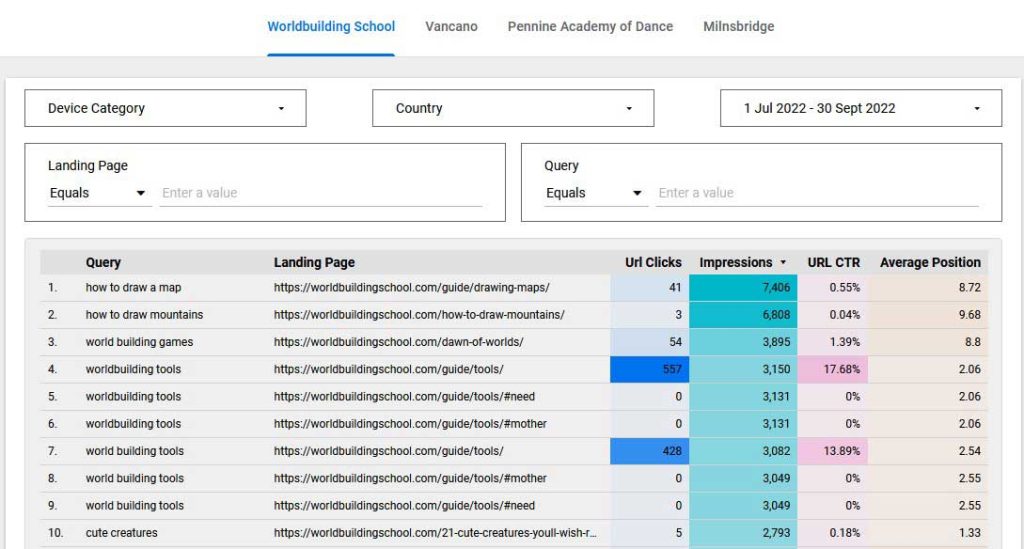
Search console interface[ADVANCED]
This is my favourite interface! It’s an advanced version of the previous one.
I’ve also created a video walk through of the interface:
Just like the simple query export this one can filter by landing page and export more than 1,000 rows.
But it has a extra features that makes it EPIC for SEO analysis, beyond things that can be done inside Search Console. I used to login daily to Search Console for keyword analysis, now I use this interface.
Starting at the top, you can see have separate pages for the website’s I’m working on (websites I own), laid out as tabs.
Then there are 4 extra filters.
- Device category
- Country
- Date
- Query
And the table has Landing Page as an extra column.
These changes seem so simple, but they improve my workflow more than I can explain in words. In fact I could write a whole article on the workflow advantages of this interface.
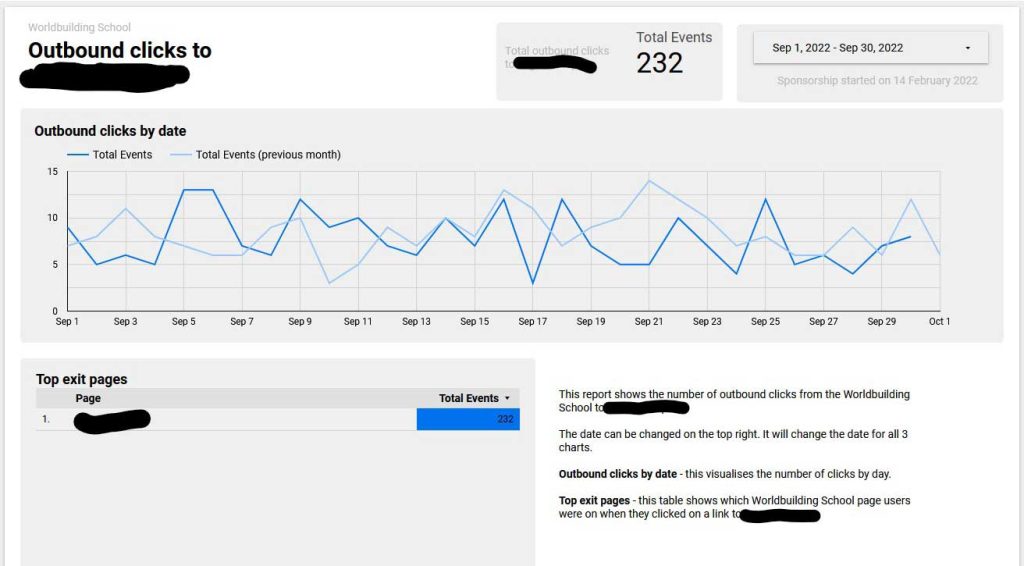
Website sponsor dashboard
When someone sponsors one of my content websites I like to create a simple sponsor dashboard for them. The dashboard means I can share data from my Google Analytics without giving the sponsor full access to GA.
Also, it’s a quick way for them to see their important metrics. Such as how many visits my website is sending and from which pages. No need to wade through screens and screens of Analytics reports just to find the few things that are relevant to them.
There is also a timeline so they can view performance by day compared to the previous month.
SME website overview
This is a narrative dashboard for busy small business owners. It gives the viewer key metrics for the website but in a flow of questions with benchmark answers.
It’s not designed for deep analysis, but rather it’s for someone who wants a top line feeling for how the website is performing.
Organic traffic databoard
I call this a databoard because it has so much data dumped into it. Brilliant for an analyst to use, but I wouldn’t expect senior management to be allowed near this without the analyst present, because it lacks insight.
Viewing and exporting more than 1,000 rows from Google Search Console
Google Search console limits results to the first 1,000 rows, even for exports. To get more than 1,000 rows you have to connect via the API and jump through some hoops to guess how many results are actually in the database. Also, most tools that do this cost money, unless you know how to write the API integration yourself.
Data Studio to the rescue.
When connecting Search Console as a source in Data Studio I’ve been able to view all of the rows in the data base. This has been a game changer for me.
You can then right click on the table and export all of the rows to Google Sheets for deeper analysis. Super simple.
Comments
One response to “Looker studio interfaces for Analytics and Search Console [dashboard examples]”
[…] my specific case I’ve built a Search Console interface that each content creator will get access to. The interface will help them to view their page’s […]